Sarang Patel
Software engineer focused on backend systems,
performance optimization, and scalable architecture.
Applying for full-time SWE roles to build fast,
reliable software at scale.
 Boston, MA, USA
Projects
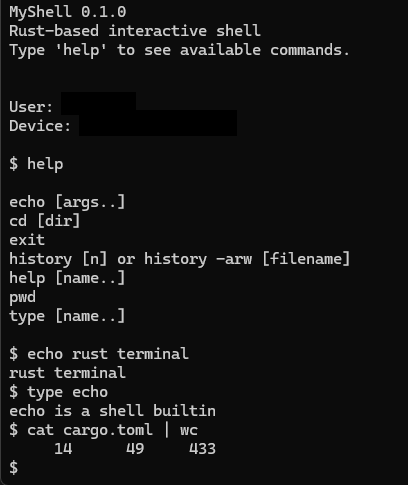
Unix-like Shell in Rust
Built a minimal, Unix-like interactive shell in Rust focused on correctness, clarity, and idiomatic design. The shell supports built-in commands, external command execution, pipelines, I/O redirection, tab completion, and persistent command history, with behavior closely mirroring Bash. Internally, it cleanly separates parsing, execution, and stream wiring while leveraging Rust's safety guarantees to avoid common concurrency and resource-management bugs.
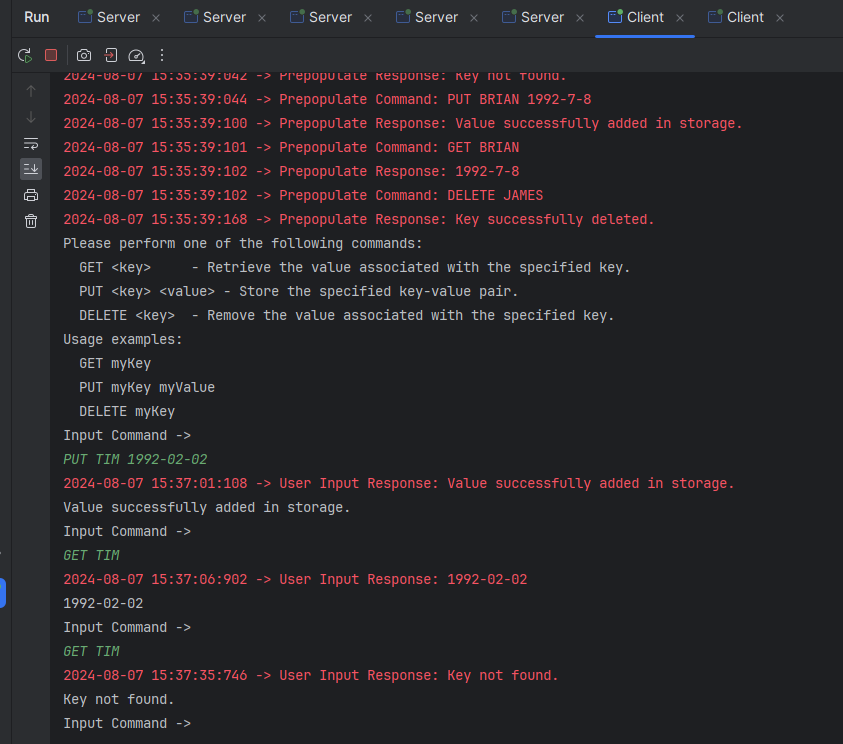
Fault-Tolerant Distributed Key-Value Store
Designed and implemented a distributed key-value store in Java using the Paxos consensus protocol to ensure consistency across replicas in the presence of failures. The system models proposer, acceptor, and learner roles, simulates random component crashes and timeouts, and coordinates client requests across multiple server instances. Emphasis was placed on correctness under failure, thread-safe state management, and clear separation between networking, consensus logic, and storage.
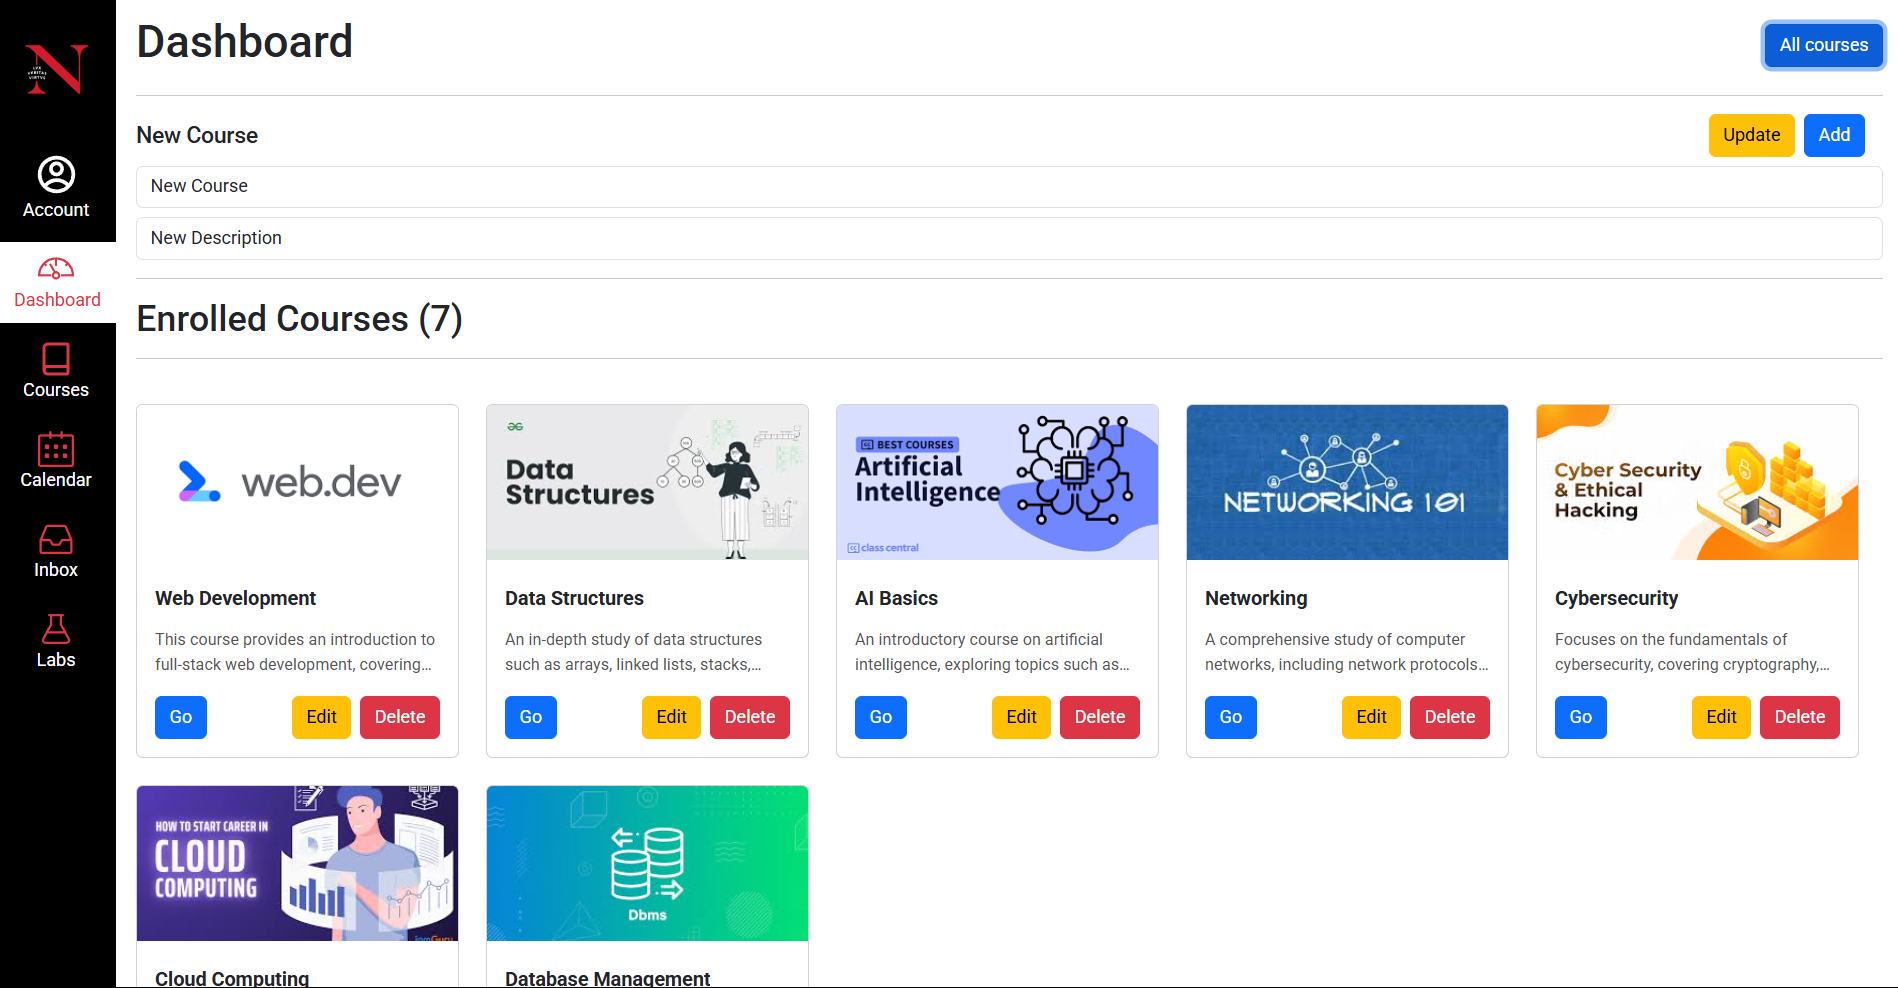
Kambaz Learning Management System

Developed a role-based learning platform enabling
secure access for students and professors using JWT
and bcrypt authentication. Built optimized RESTful
APIs and a dynamic quiz module with MongoDB-backed
data storage for courses and assessments.
Implemented comprehensive testing with Jest and
Cypress, significantly improving reliability and
reducing production issues.
Store It Cloud Storage App
Built a full-stack cloud storage manager with secure file upload, preview, and categorized dashboards using Next.js, React, and Tailwind CSS. Integrated Appwrite for authentication and file storage, using signed URLs for secure downloads. Structured a type-safe codebase with TypeScript and deployed via Netlify with environment-based configs.

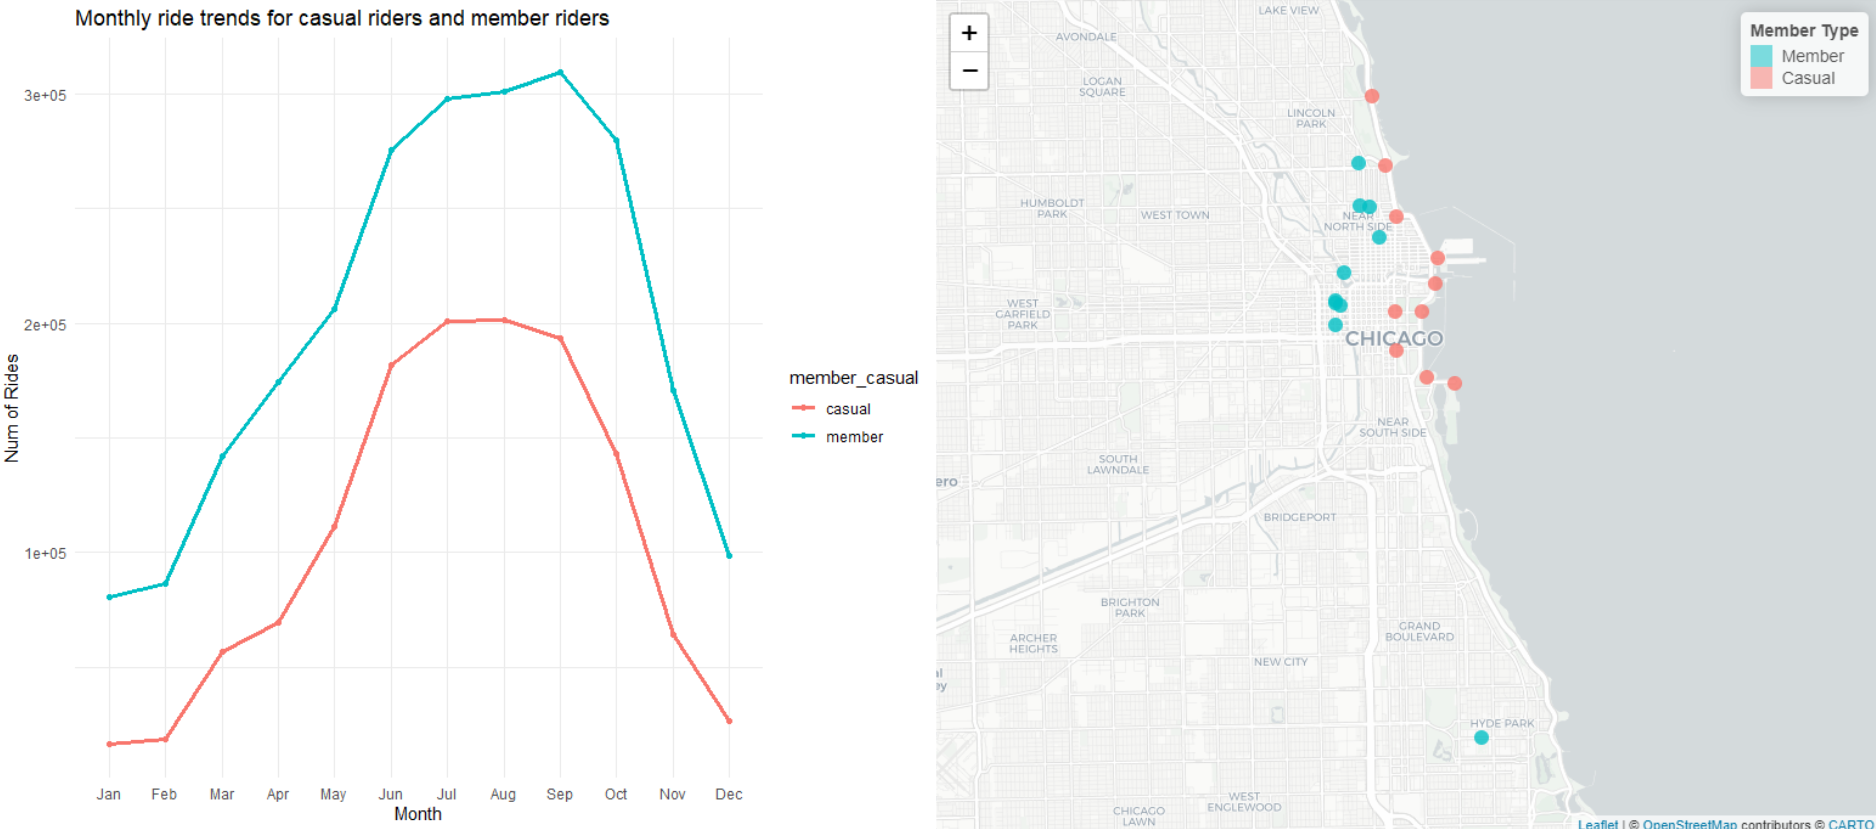
Cyclistic Bike-Share Case Study
Completed a comprehensive end-to-end case study as part of the Google Data Analytics Certificate. Analyzed over 5 million rows of bike-share data using R to uncover user behavior trends between casual and annual riders. Created actionable recommendations backed by data visualizations and shared insights to support a marketing strategy.
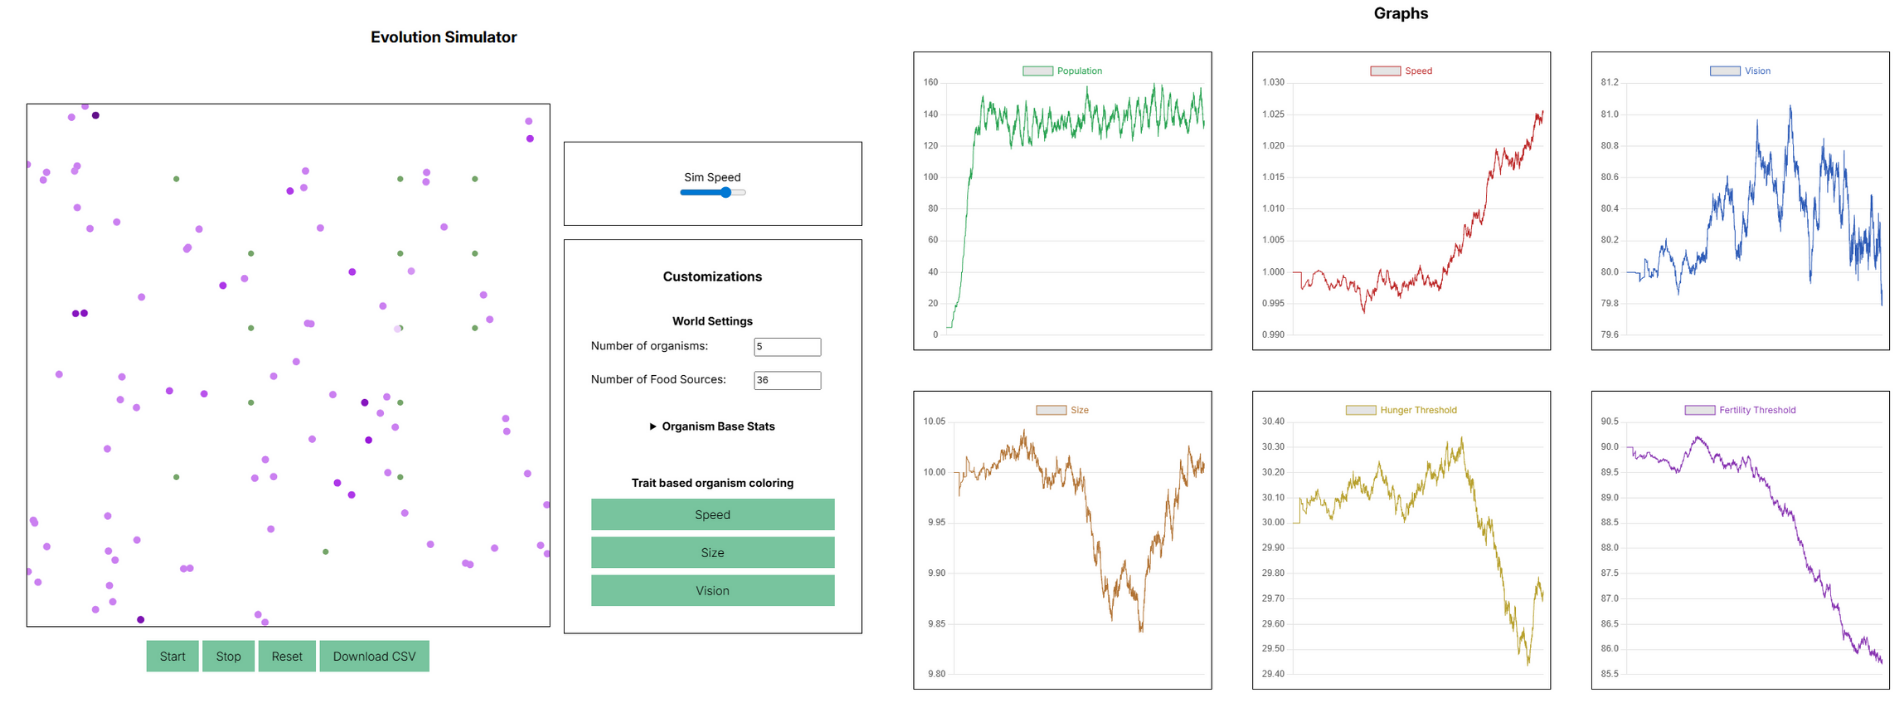
Evolution Simulator
Developed a real-time agent-based evolution simulator using JavaScript and p5.js, modeling autonomous organisms that interact within a constrained environment. Designed a genotype-phenotype system enabling inheritance, mutation, and emergent trait evolution across generations. Implemented energy-based survival, reproduction, and mortality mechanics, along with spatial food foraging and respawn logic. Built a frame-rate independent simulation loop, modular entity architecture, and data-logging pipeline with CSV export to support offline analysis of population dynamics and trait trends.
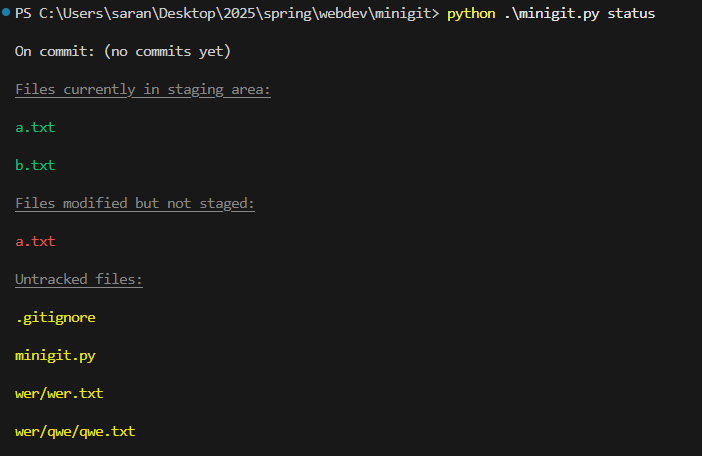
MiniGit - Lightweight Version Control System
Developed a lightweight, Git-like version control
system from scratch in Python. Supports core Git
features such as repository initialization, staging,
committing, commit logs, checkout, and working
directory status tracking. Designed an object-based
architecture using content-addressable storage and
structured commits with JSON. Includes a custom
ignore system via
.minigitignore and robust CLI built
with Python's standard library.
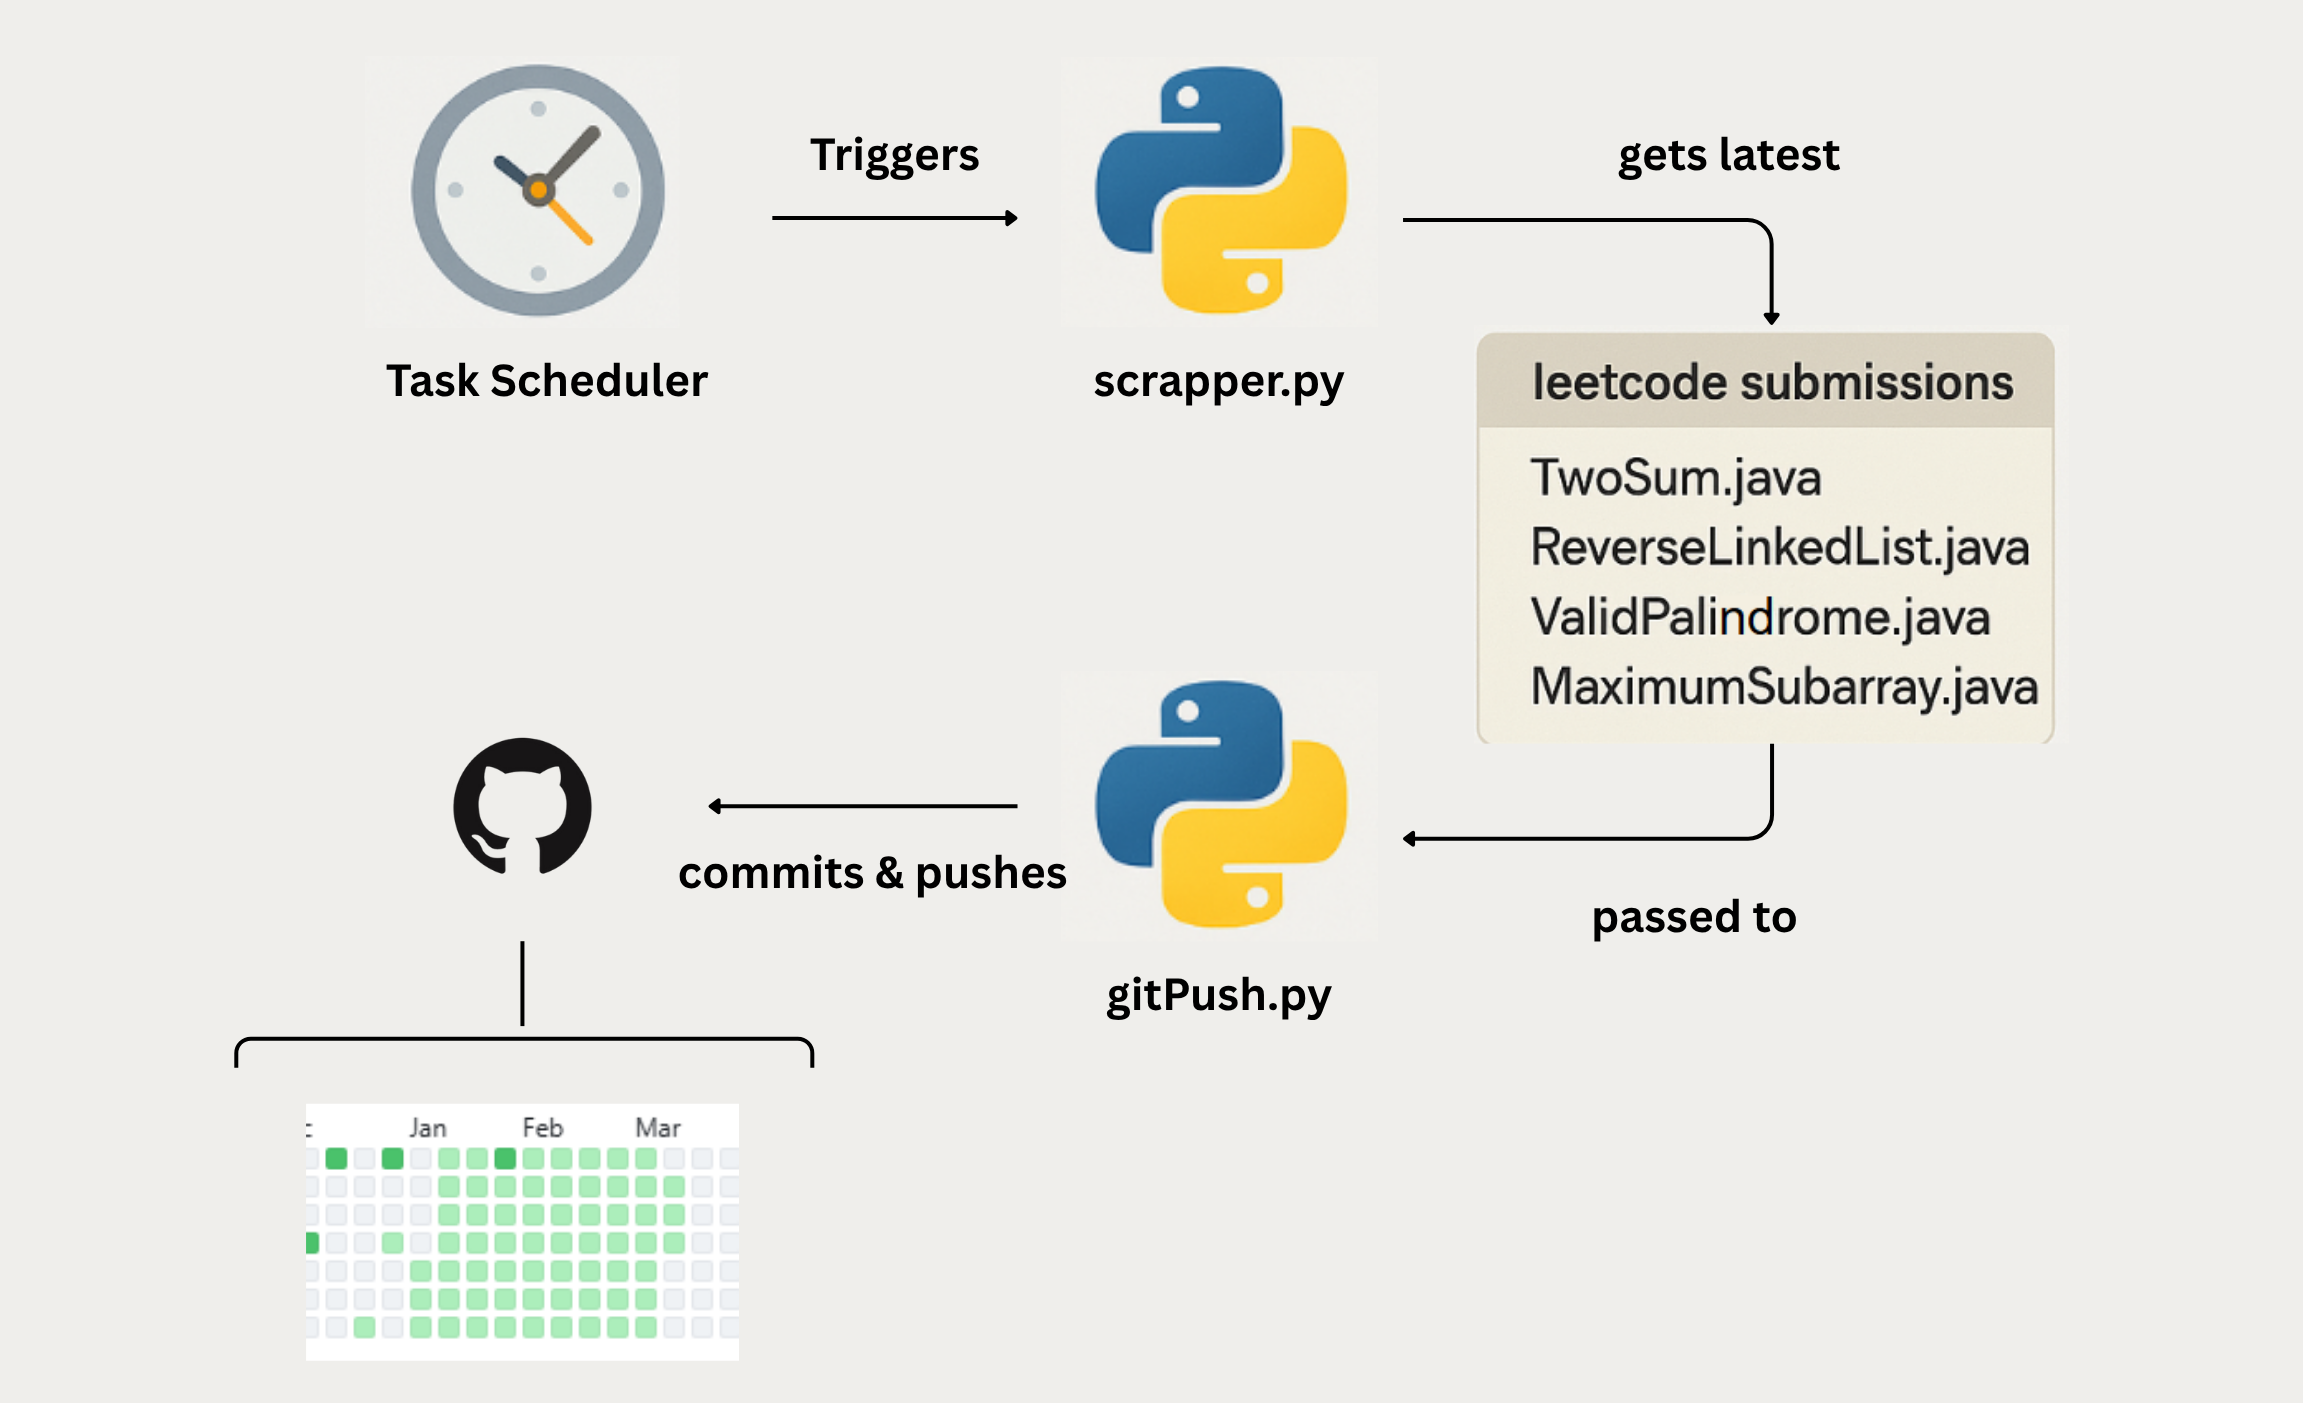
LeetCode Submission Auto-Archiver
I got tired of manually saving my LeetCode solutions
every day, so I built a Python automation tool to do
it for me. It fetches my latest submissions,
organizes them into clean code files, and pushes
them to GitHub starting from the last synced commit.
I scheduled it with Windows Task
Scheduler, and now it updates hands-free—cutting
down my manual effort by 98% and keeping a
consistent version history of my coding practice.
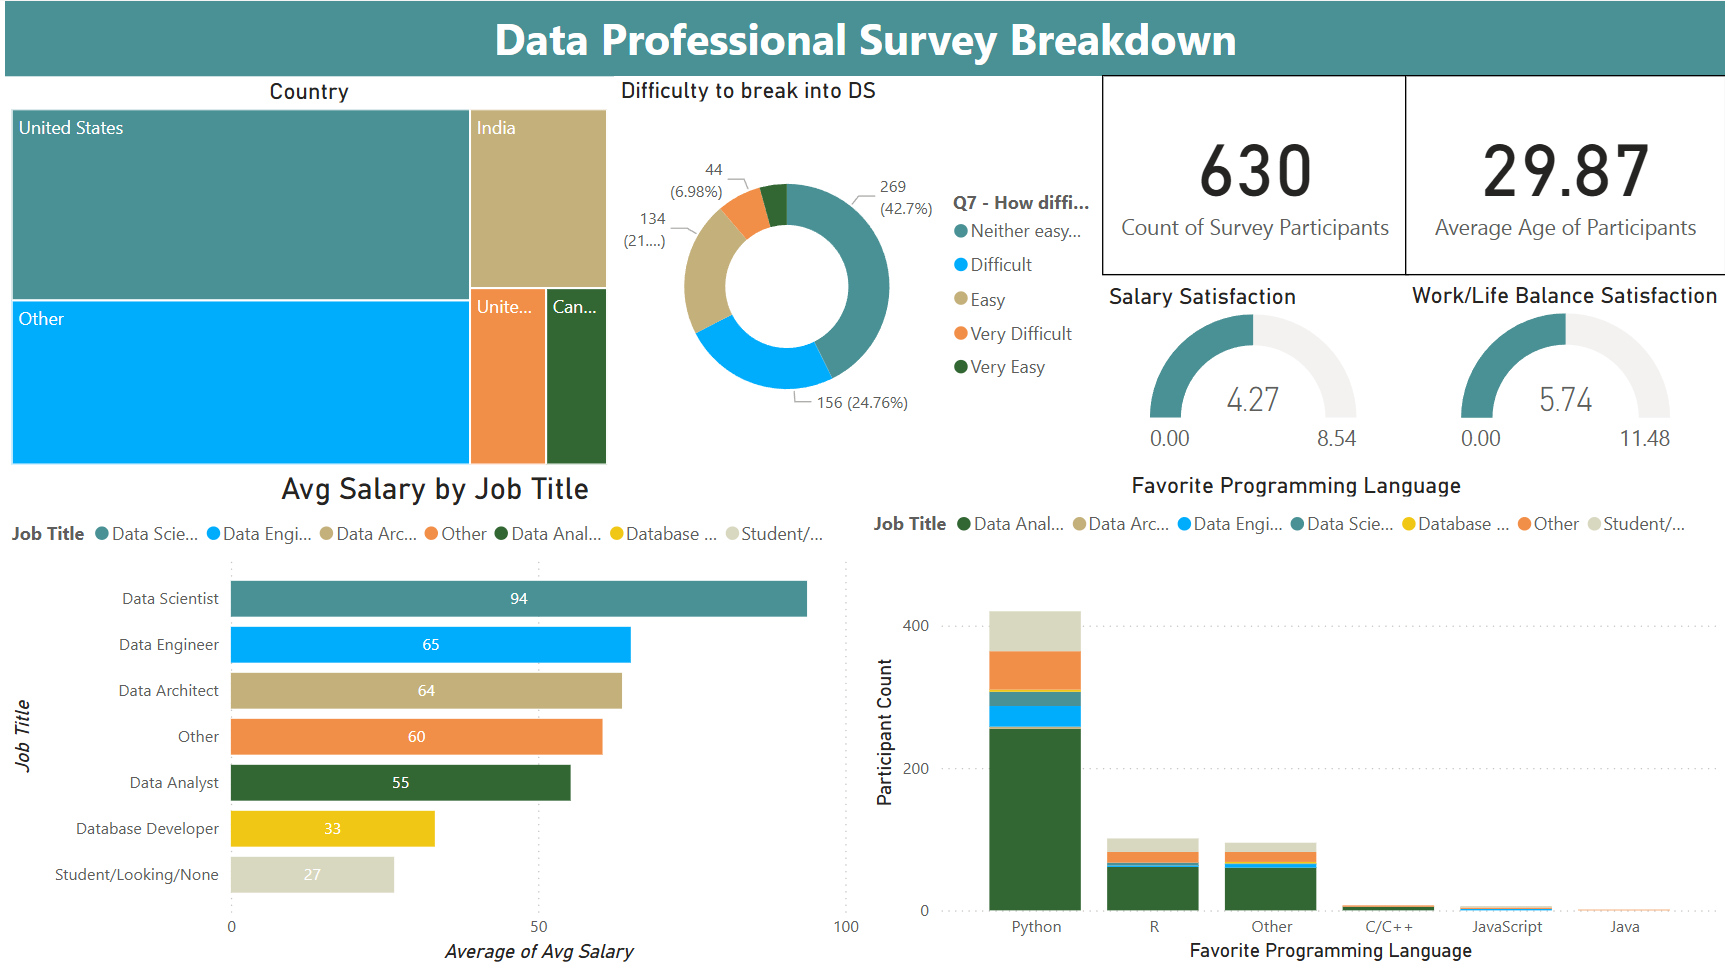
Data Professionals Insights Dashboard
I was curious about global trends in data
professionals careers—things like pay, satisfaction,
and where talent is concentrated—so I decided to
build an interactive dashboard using the Kaggle Data
Professionals Survey.
I cleaned and shaped the raw data in Power Query,
then modeled it in Power BI to surface insights like
average salary by role, country-wise participant
distribution, and work-life balance across jobs.
Through slicers and visuals, the dashboard helped me
(and potential stakeholders) explore workforce
patterns and benchmark compensation and well-being
in the data industry.
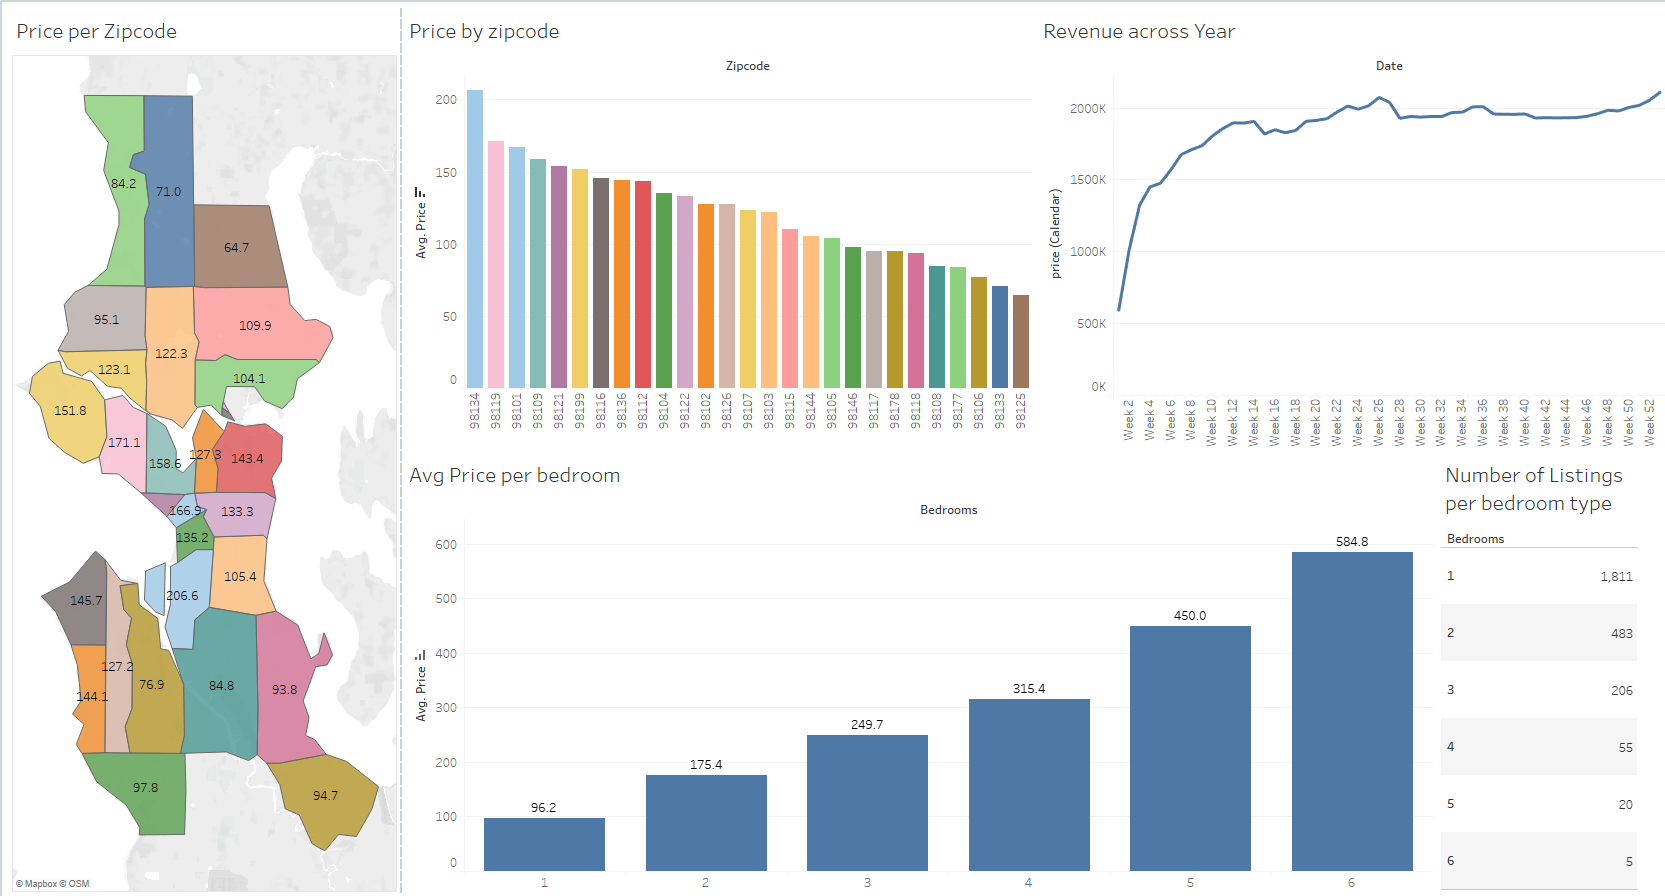
Seattle Rental Trends Explorer
My friend in Seattle wanted help pricing her
apartment listing, so I built a Tableau dashboard to
analyze local rental trends.
Using data on Airbnb listings, I
visualized average prices by ZIP code, number of
listings by bedroom count, seasonal revenue
patterns, and the highest and lowest rates charged
across the city. The dashboard gave her a clear view
of when to list and how to position her apartment
for maximum income.
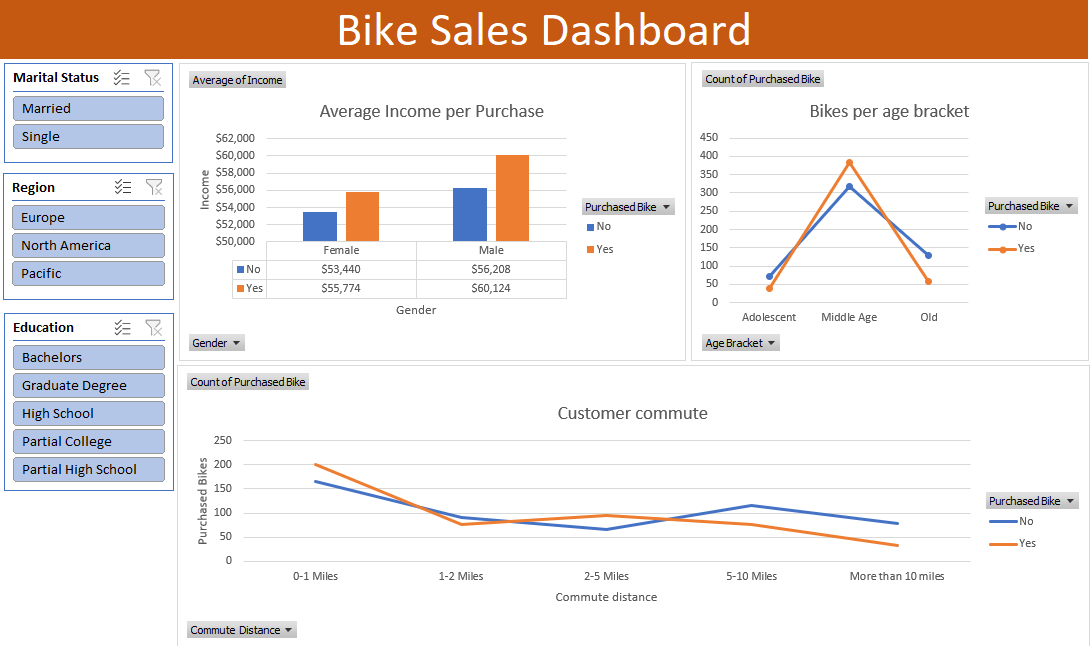
Bike Sales Demographics Analyzer
I stumbled across a rich bike-sales dataset and
convinced myself to peek beneath the surface
numbers. So I loaded it into Excel, cleaned it with
Power Query, and spun up pivot-table dashboards that
let me slice sales by age bracket, commute distance,
income tier, and region. As the charts took shape,
clear patterns emerged.
Short-distance commuters and middle-aged folk drove
the most purchases—turning a casual data dive into
an insightful look at what really moves bikes off
the showroom floor.
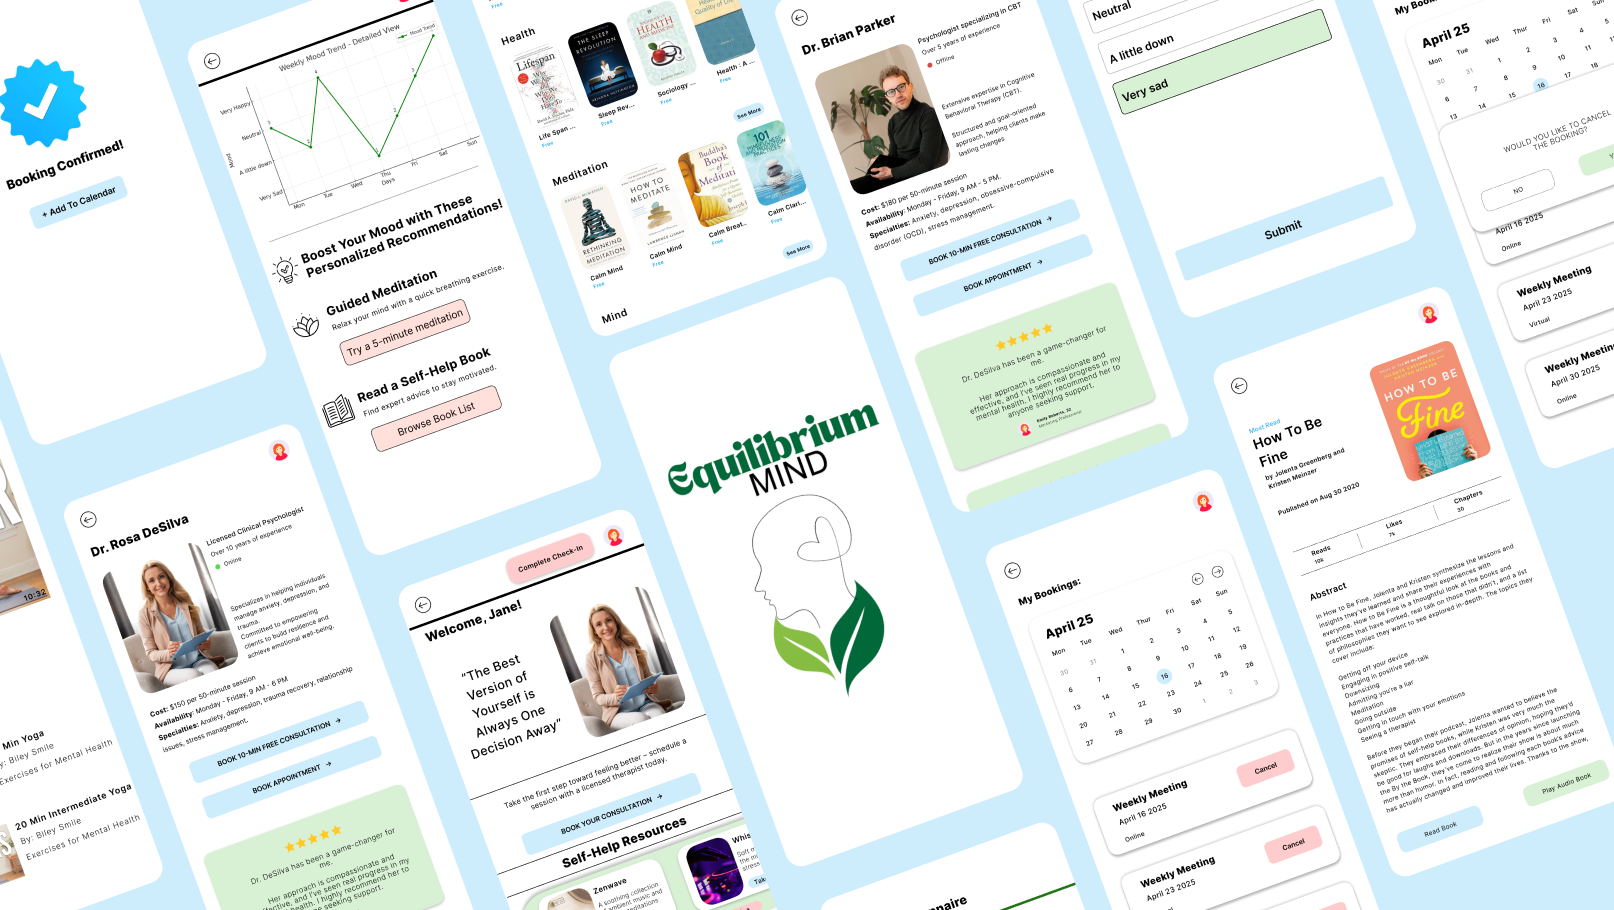
Equilibrium Mind
I collaborated with two of my friends where we
focused on creating a student-friendly mental
wellness app rooted in real user needs. We began
with competitor analysis and user interviews to
identify pain points in existing solutions, then
moved through paper prototyping and low-fidelity
wireframes.
Usability testing early on
helped shape intuitive user flows, while a heuristic
evaluation after the first high-fidelity prototype
iteration led to critical refinements. The result
was a polished, empathetic interface that delivers
personalized care through seamless navigation,
engaging content, and smart recommendations.